
How our Solar calculator works
Our solar quote calculator is designed to provide a realistic, UK-specific estimate based on typical installation costs, electricity prices and real system performance. It is not a replacement for a site survey, but a reliable starting point.



MCS - Style calculations you can trust
We want to ensure you get a quote that you can trust! Since we use calculations, assumption and models in line with the industry standard, you can be confident that the quotes we provide are an accurate guide of what you can expect!
Each of our quotes also comes with the standard MCS-style performance calculation tables to provide you with additional certainty.
Real Irradiance data to Ensure accuracy
We use real irradiance data for your specific postcode, averaged over several years, to calculate your estimated solar production. This means you can be sure that the predicted system output isn’t the “best case scenario” but a realistic picture of what your system will produce.
Our calculations are based on hourly time intervals, so we are processing a ton of data to estimate your savings accurately!


Based on your real home and preferences
Our quotes are based on your actual household usage and roof space. Since we are using a real energy demand profile for your home, you can be confident that we are providing an accurate representation of how your new solar PV system will impact your home’s energy usage.
You can add panels on a roof-by-roof basis, choose which type of panels you want, select your ideal battery size and even add optional extras to ensure you get the exact system you want.

Accurate pricing based on local installers
To provide you with accurate cost estimates, we have worked with local installers so that you can be confident in being able to get the system you have designed at the price we have quoted.
Design your bespoke solar PV System
1
Decide if you want to move forward
2
What Information the Calculator Uses
To maximise the accuracy of our quote tool, we use a lot of data. Some from you, some from industry experience, some real data from various trusted sources!
- Annual Electricity Usage
- Energy Usage Profile
- Real Irradiance Data
- Roof Angle
- Roof Orientation
- Roof Shade level
- Solar Panel type
- battery Size
- current electricity tariff
- Optional Extras
- system Losses
- System efficiencies
- Alternative UK Tariff options
- MCS-style calculations
- Smart Tariff optimisation
- Real installer prices
- Panel Degradation
How We Calculate Your System Production
How much power your system produces and when it produces it are important factors in determining the savings your system will generate. Therefore, we ensure we calculate this as accurately as possible. Here we will outline and explain the process and calculation so that you can be confident in the accuracy of your estimate.
System Inputs
Real Solar data from your location
To calculate your system production, we need some help from you! Firstly, the amount of power your panels produce is dependent on your location. Therefore, we need your postcode so we can use real irradiance data from your area.
The roof Space you want to use
Next, we need to know about your roof space. We get you to add panels on a roof-by-roof basis to maximise the accuracy of the calculations. You tell us your roof size, its angle and orientation, and we can calculate your system output.
The shade your panels will face
We are almost there; however, if we don’t factor in shade, you will get unrealistic calculations. Since most homeowners don’t spend all day staring at their roof, shade can be hard to gauge. Therefore, we give you three options to choose from.
The type of panels you want
Whether you want standard panels or premium panels will affect how much your system produces. Premium panels tend to have higher efficiencies and therefore higher output. They also have slower degradation, which means they produce more power for longer. However, they do come at a slight cost premium.
System Outputs
How we calculate Panel output
To accurately calculate your system output, we use PVGIS on a roof-by-roof basis, providing us with hourly system output. PVGIS is provided by the European Commission Joint Ventures Centre and provides information on solar radiation and photovoltaic system performance for any location in the world, except the North and South Poles.
Using this, we can factor in typical system losses, system size, roof angle and orientation to provide industry-standard solar production data.
A Multi-year average
Using a single year of solar production would be great. However, it allows for anomalies, especially when looking at hourly data. As we know, here in the UK, the weather is very unpredictable; we can have the sunniest July on record, followed by the wettest June in a century. Therefore, we use the solar production over several years and take an average to reduce anomalies and give you a more accurate output.
System Degradation over its lifetime
All solar panels produce less power as they get older. However, this rate depends on the quality of the panel. Therefore, to provide accurate payback periods and lifetime savings, we have factored this into our modelling depending on the type of panel you choose.
Electricity Price Assumptions
Before we look at how we calculate the financials, it’s important to first look at electricity tariffs. However, this is fairly straightforward because you have a lot of control!
You have full control of your energy tariffs!
Our calculator allows you to customise the tariffs used to work out your savings. You have a before solar and an after solar tariff. Therefore, you can see exactly how much your system will save you. There are three options for you to choose from. First, you have a Standard Variable, which has a flat rate for imports and exports. Next, there is an off-peak tariff which is based on E.on Next Drive or Octopus Go. This gives you a window of cheap electricity imports between midnight and 7 am. Finally, there is a Flux tariff based on Octopus Flux. This tariff has variable import and export prices throughout the day.
For exports, apart from for flux, we use the flat rate of 12p/kWh, which is widely available.
How your Electricity Price changes overtime
Electricity prices are a little hard to predict as they depend on so many factors. This has been especially evident over the last 5 years or so. However, if you’re in one of the 65% of homes in England, Scotland or Wales on a standard variable tariff, the price you pay is controlled by the Energy Price Cap. This is confirmed to be falling by 6.7% on April 1st, 2026.
Currently, your projected energy cost is calculated by considering a 6% increase in energy cost each year, due to trends in the rising cost of energy.
How Savings Are Calculated
Now you know how we calculate your system production and what the electricity rates we use. Next, we need to look at how that leads to your savings! Below, we will give a detailed explanation of how we calculate this!
Two Sets of 8'760 Data points
We take your annual electricity usage and your daily usage profile and create a set of hourly usage curves for each day of the year. We factor in seasonal trends in usage, for example, how we tend to use more electricity in the winter months.
Next, we take the hourly solar production data, which has been averaged over several years and overlay this with your household usage.
Determine your self consumption
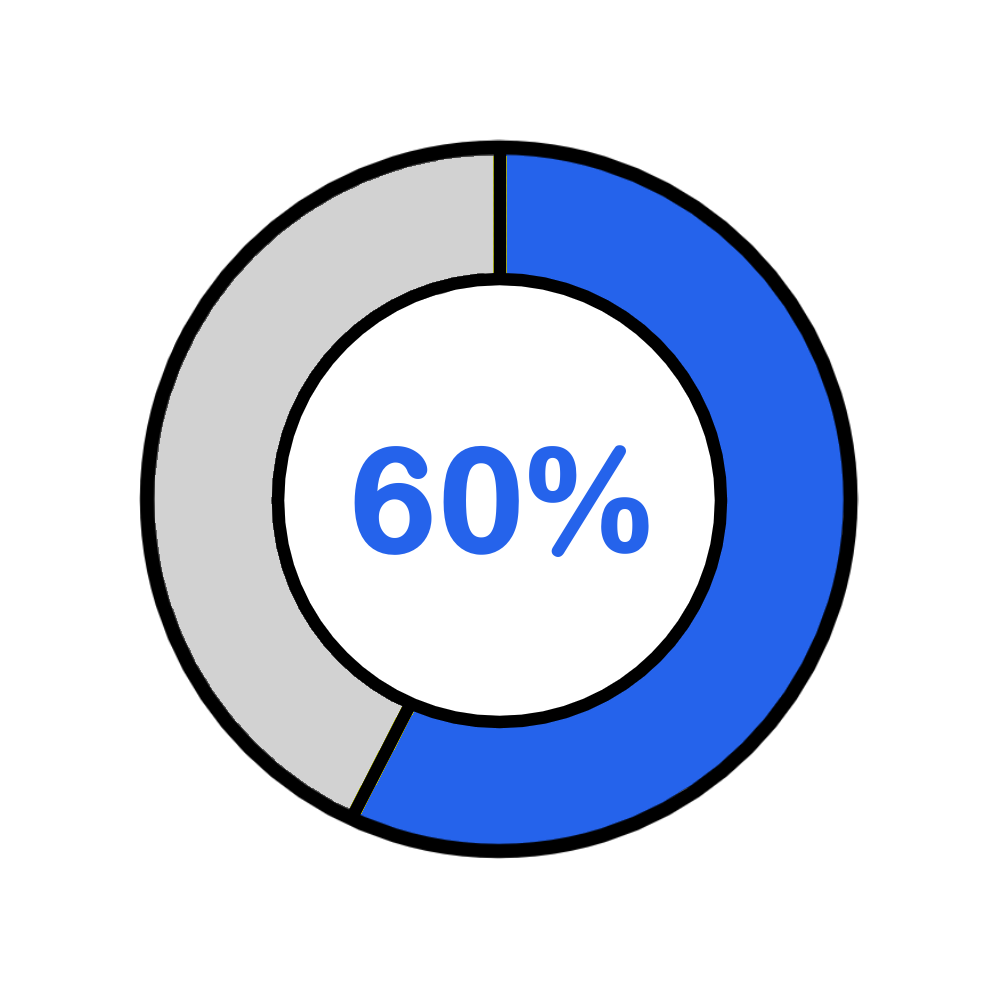
Using these two data sets, we can see how much solar production is used directly to power your home. We can also see how much is exported at any given hour or how much is imported to cover your demand.
This tells us your self-consumption. A very important stat for solar savings, as we discuss in detail here. After this, we know exactly where electricity is flowing each day of the year!
Calculate your New Electricity Bill
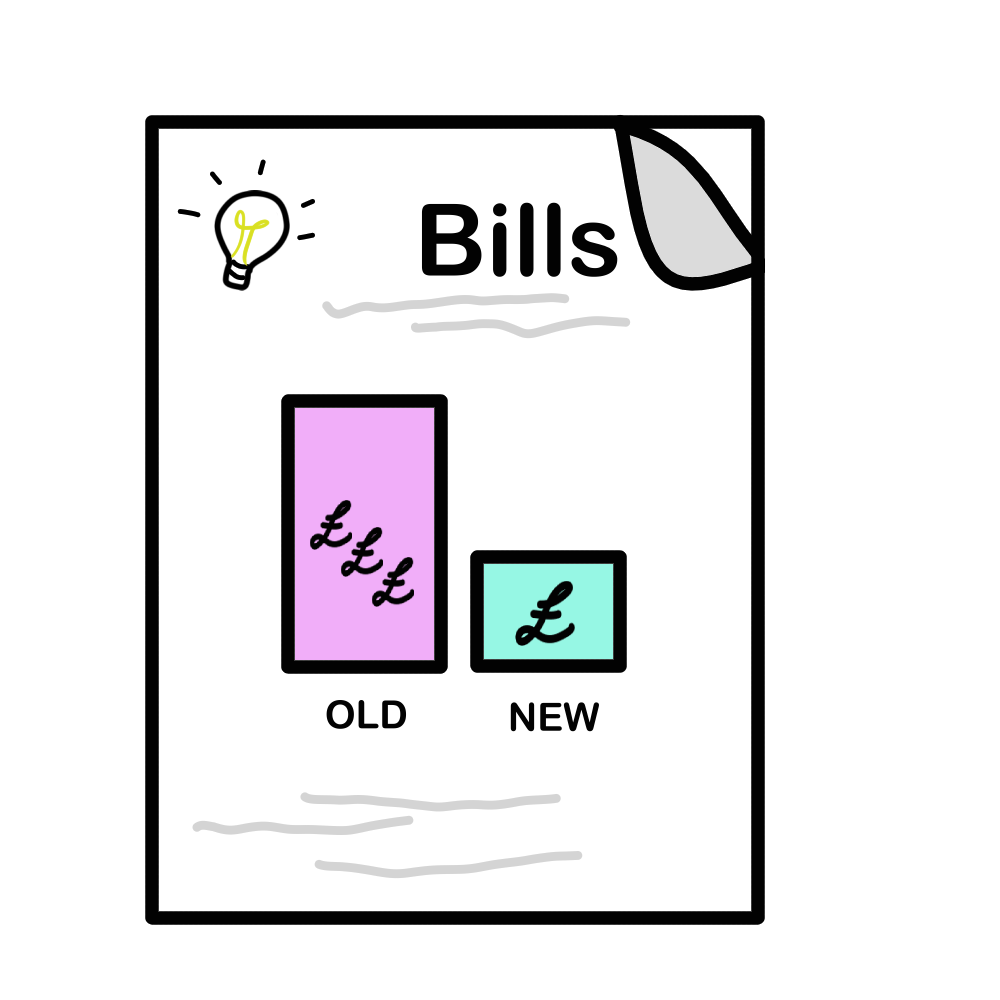
Now that we know how much electricity you import and export, we can calculate your new bill after solar. Since we know what happens each hour, we can model how the time-of-use tariffs affect your bill savings.
We do this by multiplying your kWh of import by the correct price for that hour and the same for export before totalling these for daily, monthly and yearly data. Finally, always add daily standing charges.

Find your savings into the Future
Finally, we need to calculate how your savings change from year to year. To do this, we need to factor in how your panels degrade as well as how energy prices increase from year to year. Most panels promise a 1st year degradation of less than 1%, followed by around 0.35-0.5% each year after this. While, as discussed above, we model a 6% increase in energy cost each year, due to trends in the rising cost of energy.
How Battery Scenarios Are Modelled
Battery storage has become a key component in most solar panel installations and for good reason. Battery storage increases self-consumption, helping homeowners maximise their savings. If you are wondering about the cost vs savings from battery storage, then check out our page here.
How you utilise your battery will have a large impact on the savings you see. Therefore, to give you a realistic picture of what you can expect, we have modelled 3 types of battery control settings. Let’s have a look at how each of them work.
Self-consumption Mode
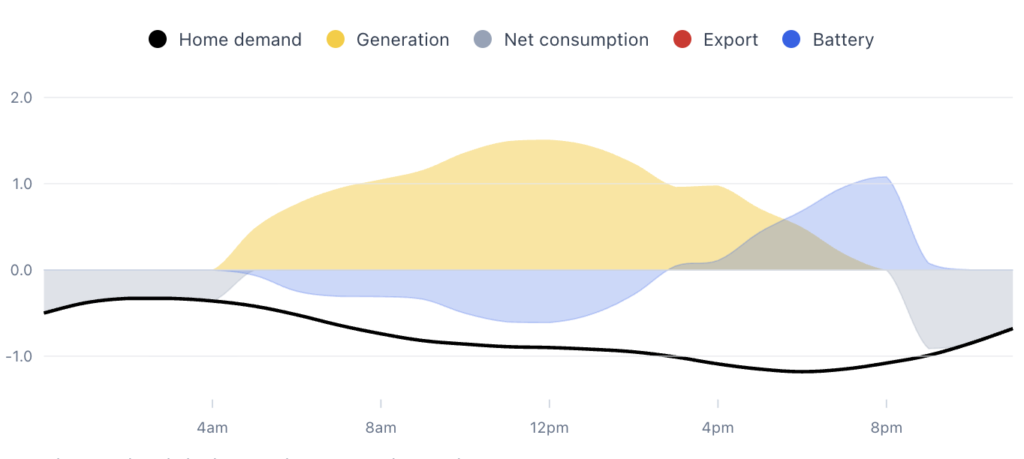
The first setting is the self-consumption mode. This is the default setting as it’s the simplest. In this mode, your battery will charge when there is excess solar (when solar generation is higher than home demand). It will continue to do so until the battery is full.
However, when home demand is higher than solar generation, it will discharge to cover the load. Therefore, maximising how much of your solar generation you use. We discuss the importance of self-consumption here.
Grid-Charging Mode
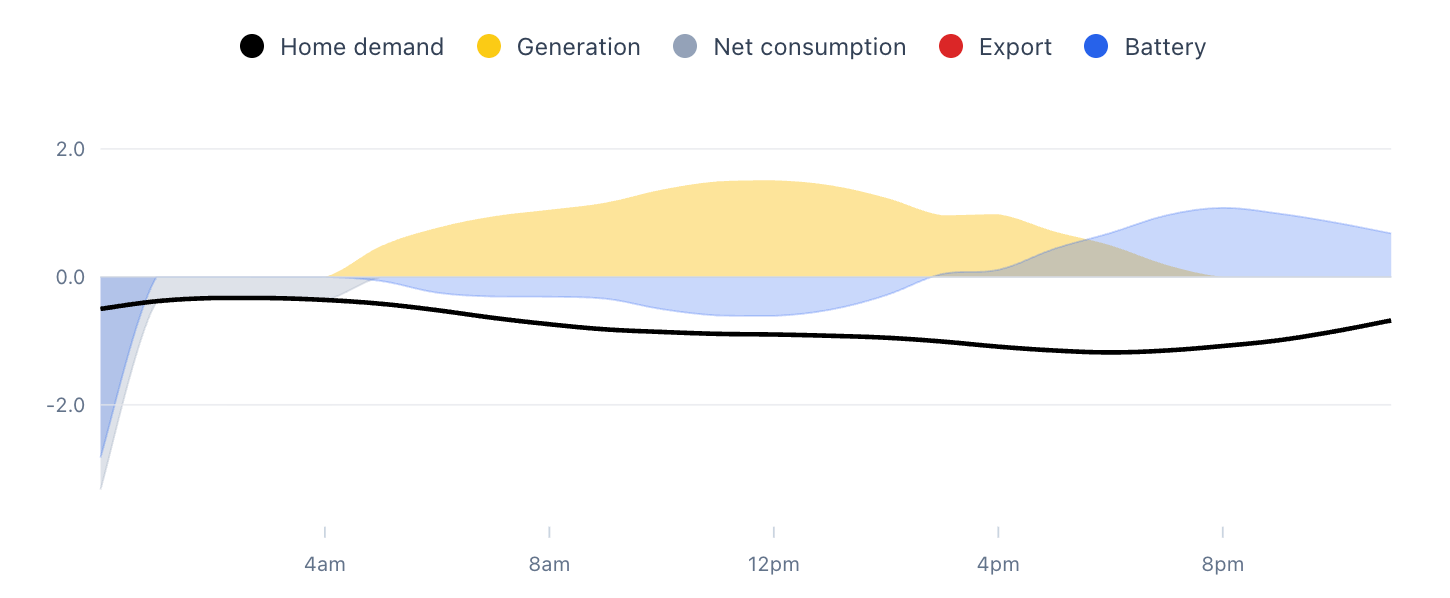
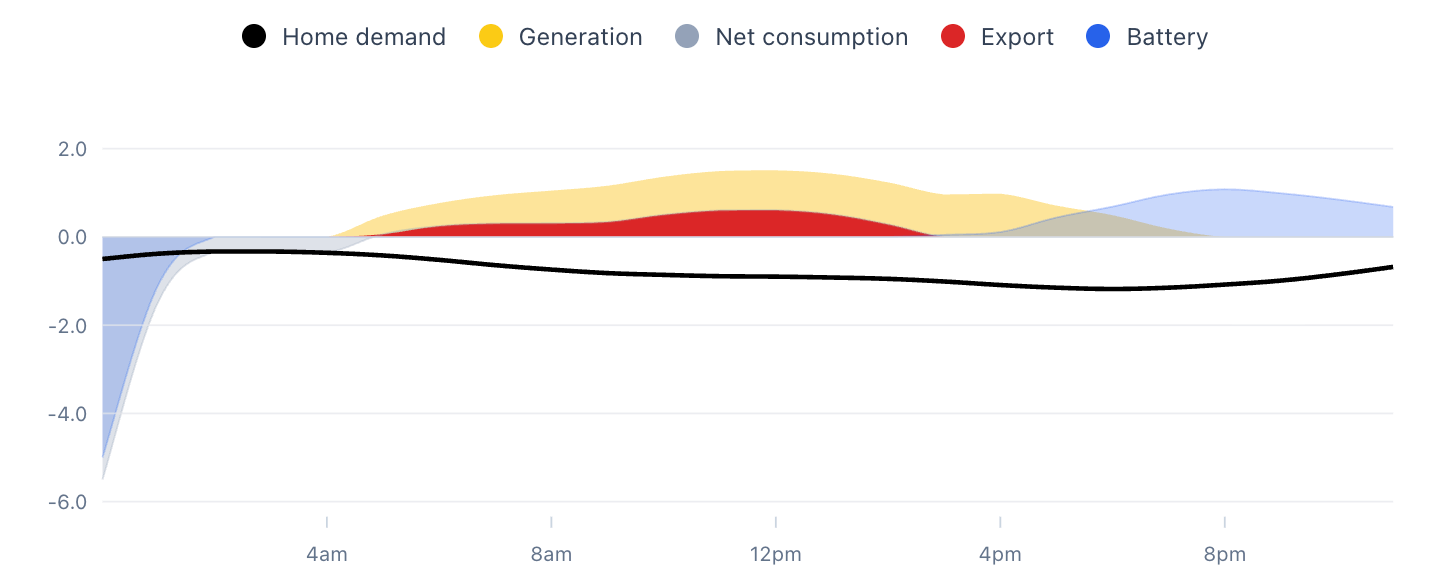
Next is the grid charge setting. When this is turned on, the battery can charge from the grid during cheap hours, then discharge later to reduce imports. This is a little more complicated than it sounds because we need to make sure of a couple of things.
Firstly, we don’t want to charge the battery to cover the home demand that our solar can cover, unless our grid export price is higher than our off-peak import rate. We would rather use 7p electricity from our battery than 12p electricity from our solar that we could export.
Secondly, we need to factor in battery round-trip efficiency. Charging the battery isn’t perfectly efficient, so we lose a bit of power when charging and discharging. Its important we factor this into any calculations.
Energy Trading Mode
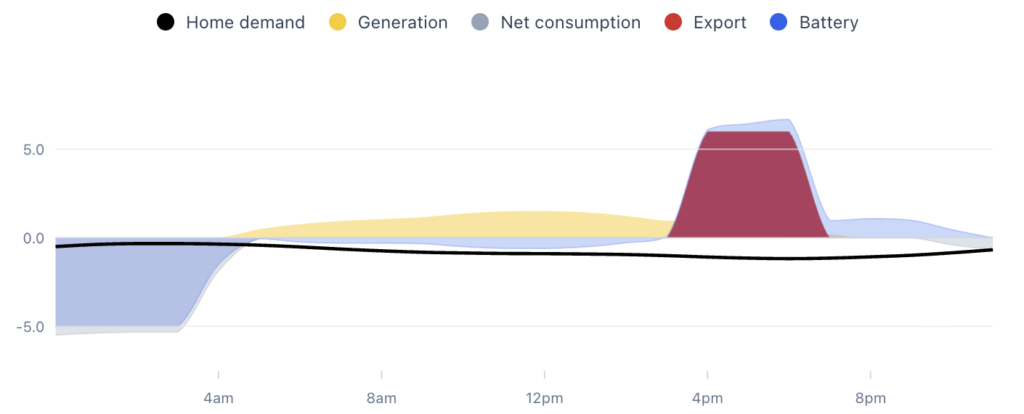
This final setting is the most complicated. Energy trading is when we buy cheap electricity to export back to the grid when the prices are highest. This is only really viable on flux tariffs as most other block this type of behaviour.
This is the most complicated because we need to account for several factors. Firstly, we need to make sure all calculations factor in battery charge efficiencies. Next, we want to make sure we aren’t discharging our battery to exports when it would be better to cover our home demand later. Then we want to make sure we have battery capacity to charge from excess solar when exports are cheaper than the off-peak electricity we could charge from.
As you can see, this is a complicated setup and isn’t possible to set up on all inverter software so keep that in mind.
What the Calculator Does NOT include
As great as our quote calculator is, it does have some limitations. Some of which we are working to resolve, and others that can’t be fixed without a site survey.
Site Survey Limitations
First, let’s look at the limitations we won’t be able to overcome without a site survey
- Roof Structural Conditions – To determine if your roof is suitable for solar, an installer needs to conduct a proper survey of the roof’s structure. Therefore, without a site visit, we can’t help you there.
- Scaffold Specifics – Whether you need a scaffold that extends over a conservatory or any other obstacles is also typically determined during a site survey or with a ton of pictures. Therefore, although we price scaffolding into our quote, how much this will actually cost isn’t something we can tell you!
- Accurate Shade analysis – It is possible to get a detailed shade analysis, especially as satellite imagery improves. However, some locations don’t have 3D imagery, and even if they do isn’t always up to date.
- Installation Locations – Where you want to have your inverter and battery installed is a big part of the cost of your installation. Cable routes and electrical system upgrades can vary drastically and therefore affect cost.
Additional factors not included
This is a list of details that we don’t (currently) factor into the calculations.
- Planning Restrictions and Costs – Although installing solar panels is considered permitted development, in some cases, planning permission is needed, and this comes at a cost. If you live in a conservation area, then this is definitely something to be aware of.
- Brand Specific Pricing – Which brand of solar equipment you want will significantly impact your final system cost. If you go for a budget/ cheap option, then your system cost could be 10-20% cheaper than a high-end manufacturer’s option.
- Government Incentives – Our quote tool does not tell you if you qualify for any government incentives that could reduce the price that you pay for your solar installation.
- Installer Price Differences – Although our pricing is based on real installation prices, they aren’t the actual price from an installer local to you.
How accurate are our solar estimates?
Online solar quotes are not a replacement for a full site survey. However, a well-built calculator using realistic assumptions can provide a reliable cost range and savings projection.
There are a lot of factors that go into determining your final installation cost, some that no online estimate can determine, so we always recommend getting a site survey before moving ahead. The reason we give you an estimated price range rather than a definitive price is to factor in the price variations you will see after a site survey. Where you choose to install your battery and inverter, if you have space in your current fuseboard, and which brands you go for, will all determine your final price.
Our estimates are designed to provide you with a clear picture of what you can expect from your solar PV system to help you determine if solar is worth considering for your home. We have gone to great lengths to make sure that our estimates are helpful to you. From using real historic weather data from your actual location, to giving you customisation of your battery size and panel type. This is an estimate that you can trust.
Why We Built this Quote Calculator
The solar panel industry has a high technical barrier, which has put homeowners in a tricky situation. They either have to spend significant time researching and learning, or rely on the knowledge of their installer.
In most situations, relying on industry experts is a good idea; however, there is a lot of conflicting advice among solar installers. This is for two reasons. Firstly, solar advice is very situation-specific; therefore, advice that is right for one homeowner might be wrong for another. Secondly, to find out what the correct/best system is for a home takes a lot of work! There are so many variations and options on each component that make up a solar installation. Therefore, for an installer to find the best system for a homeowner, they must spend significant time trying various combinations of panels, inverters, batteries and tariffs.
This has led to most installers offering “cookie-cutter” solutions that minimise their workload but also minimise the homeowner’s potential savings. Our goal is to make sure each homeowner gets an optimal system while reducing the design burden on installers.